Seth Karten, February 23, 2023.
University rankings such as USNews can be gamed to account for its categories and also places a fair amount of preference of "peer score". CSRankings tries to alleviate these blackbox rankings by finding a merit-based way to rank universities. Though, this largely favors larger universities that have more students and thus a larger research output. Additionally, the impact of a paper is not well categorized. In this study, we aim to take into account both student impact and size normalization. Becoming a professor has particularly low odds. That being said, if a university is able to place PhD students into professorial roles consistently, that is quite the achievement. We say that magnitude is not enough, rather we investigate the role of normalized placements based on the number of degrees conferred.
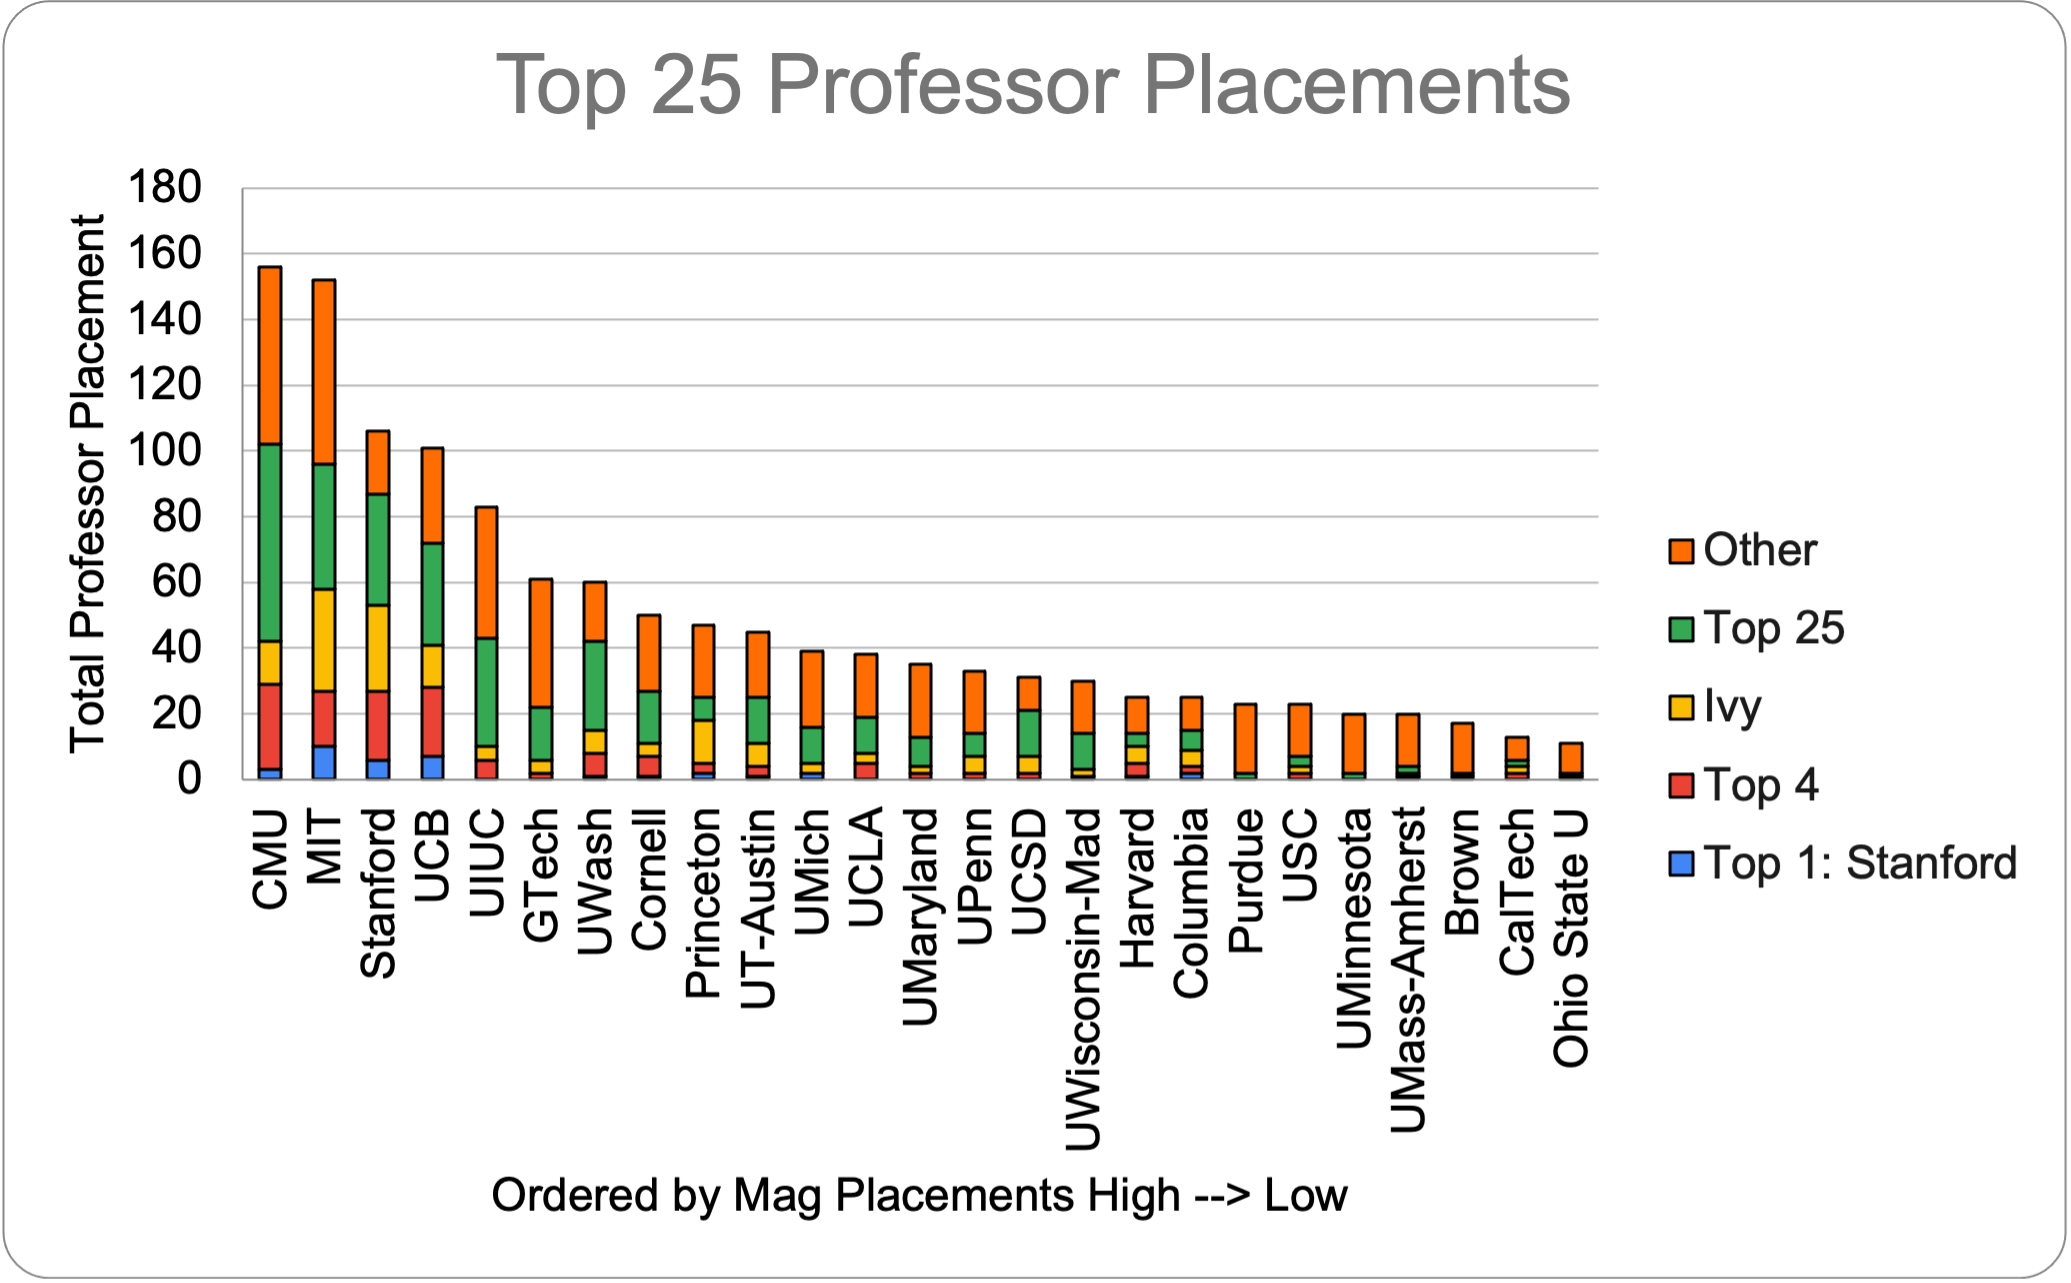
Why bother normalizing the placements at all? This data reveals nothing new. The rankings roughly follow USNews and CSRankings.
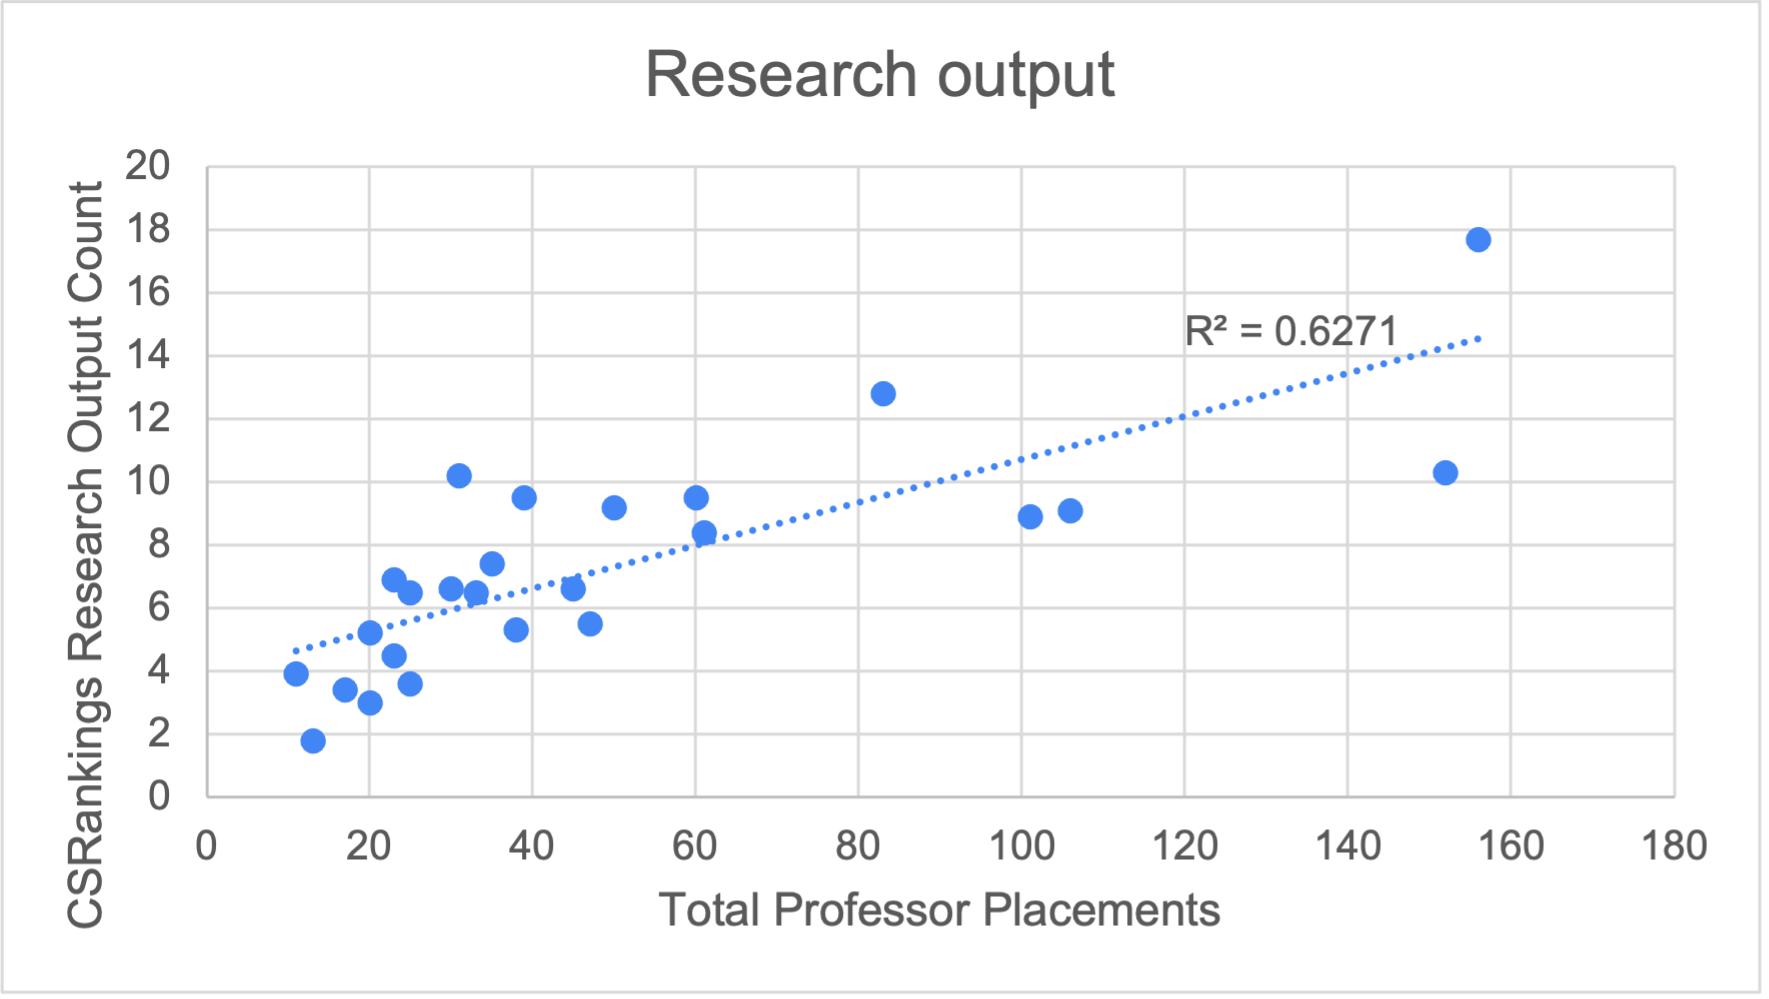
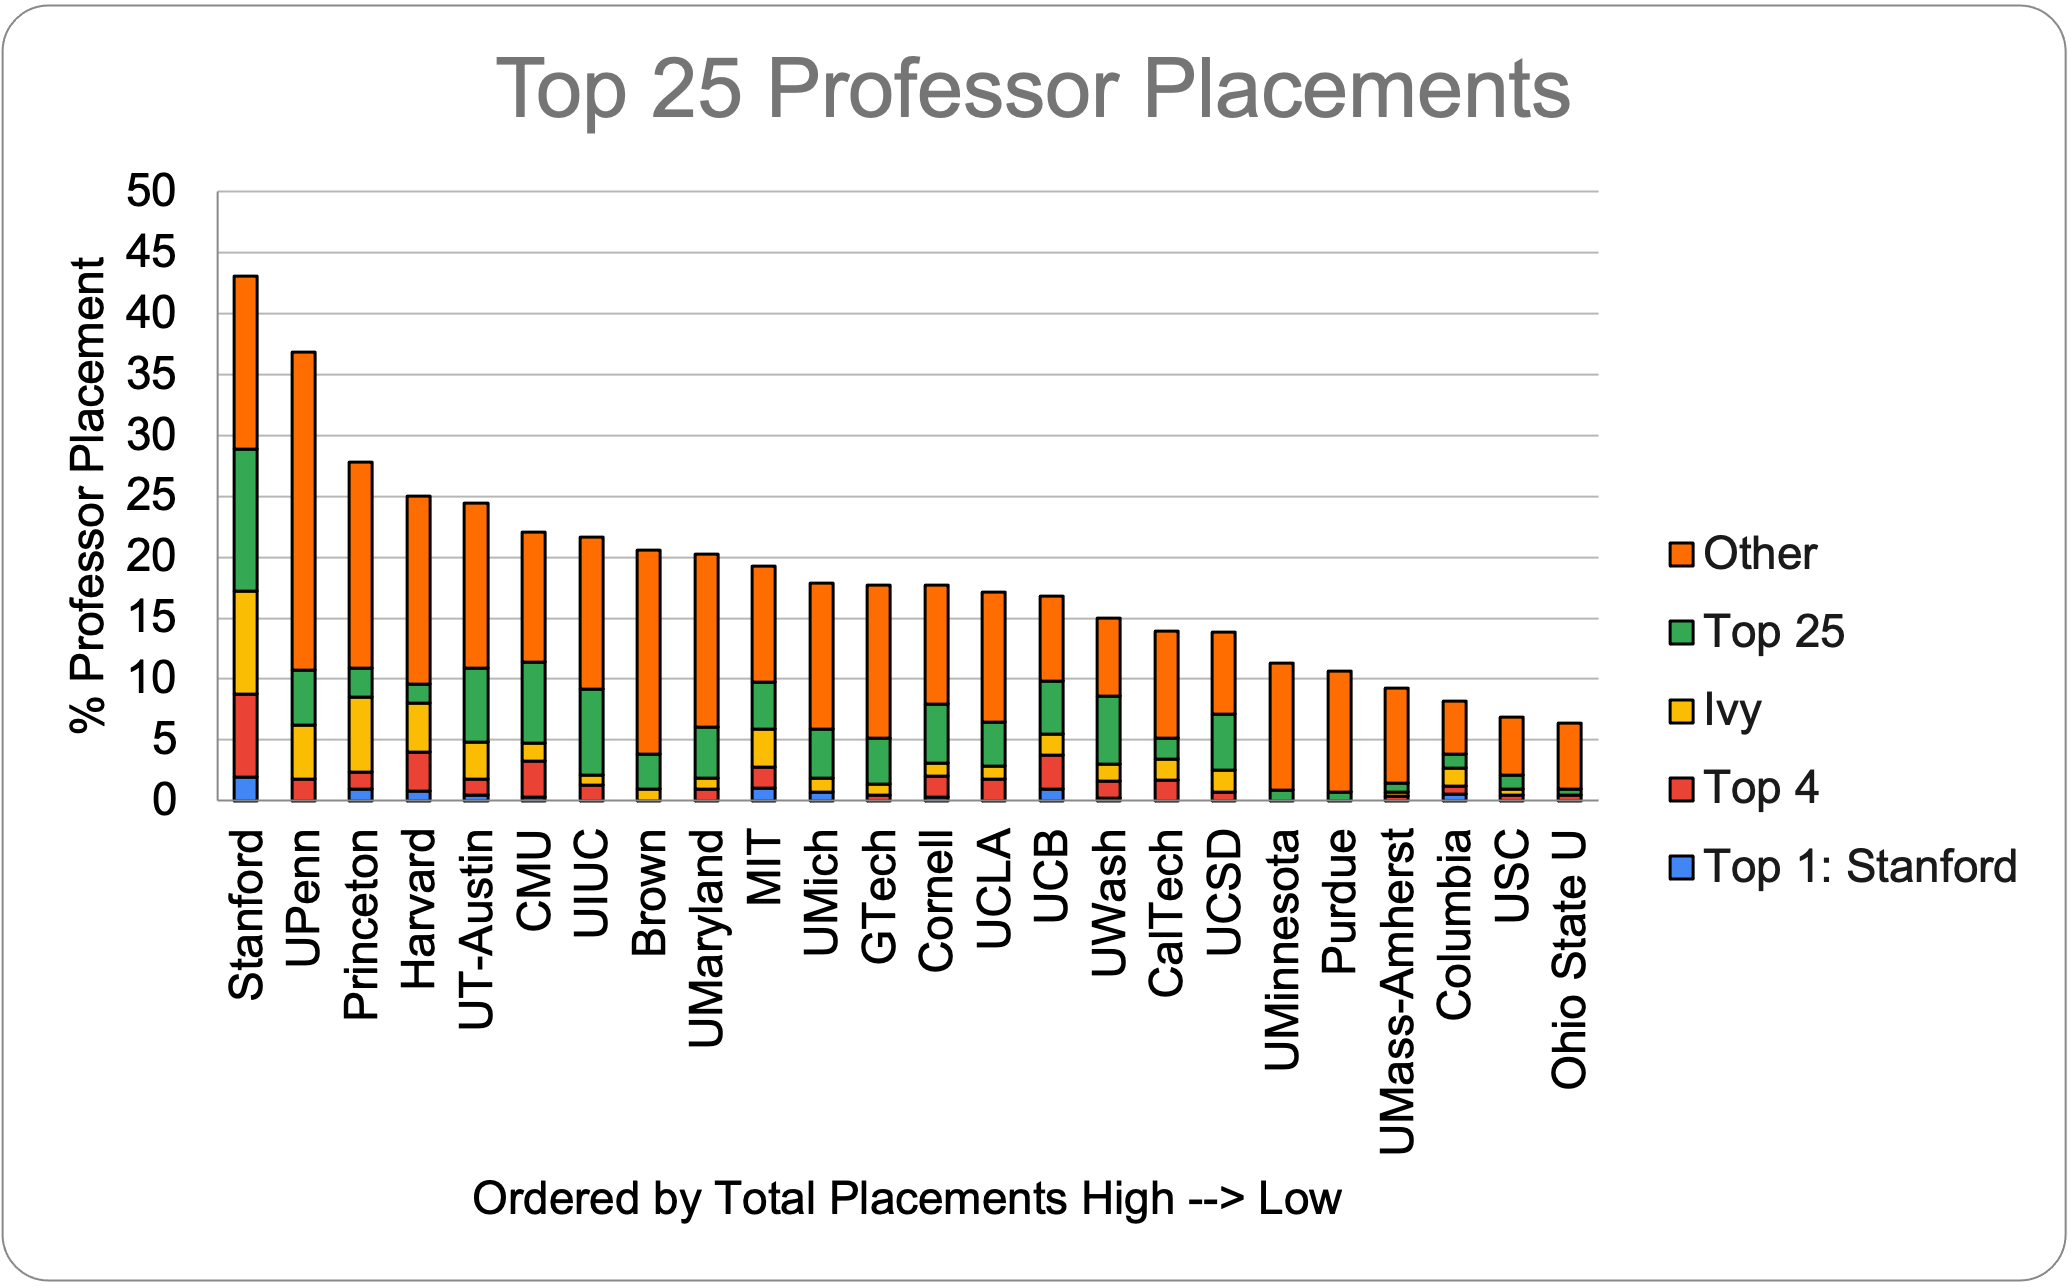
As shown below, magnitude of one paper metric is correlated with magnitude of professor placements metrics.
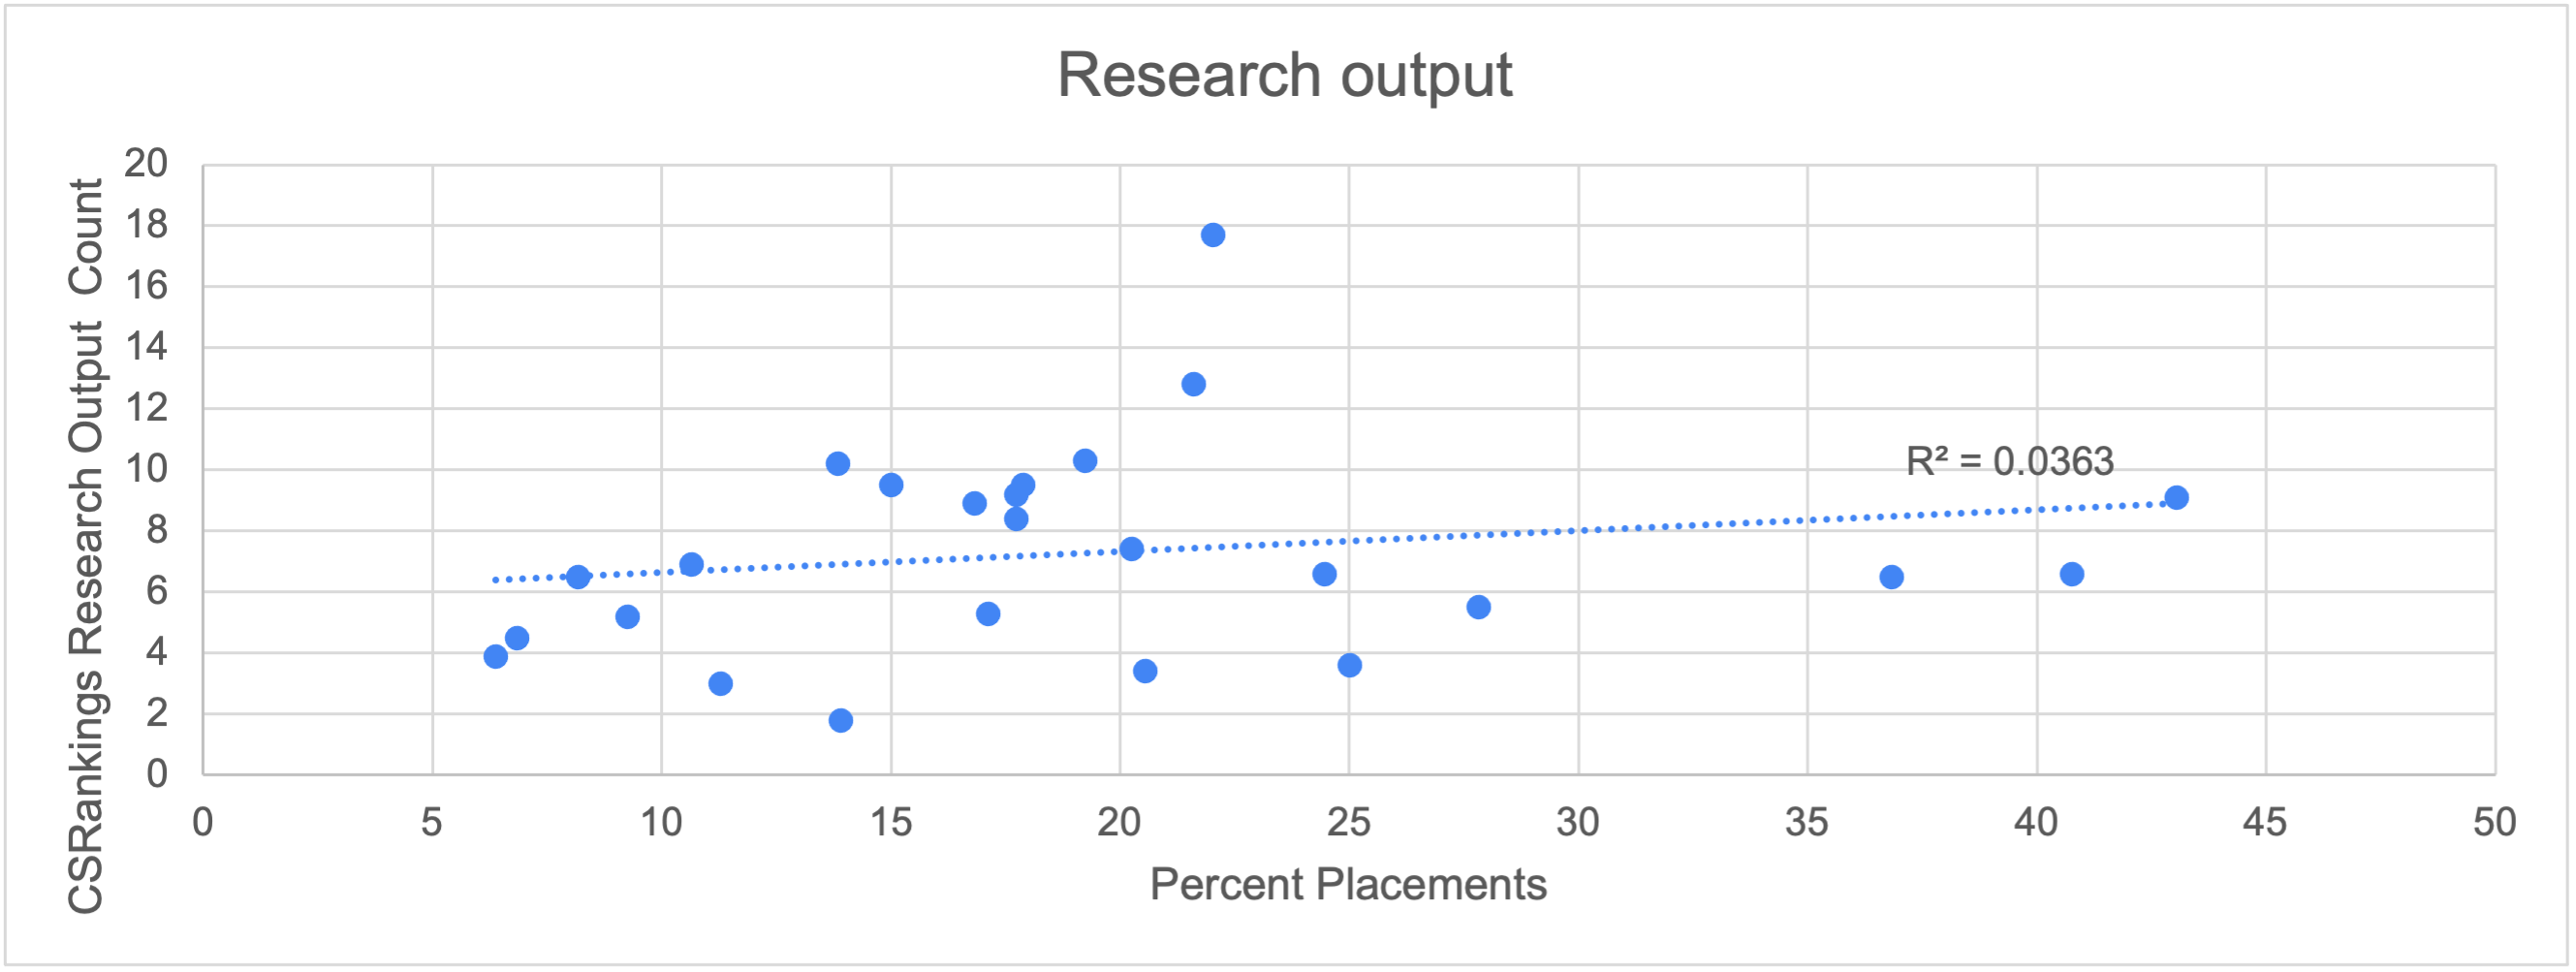
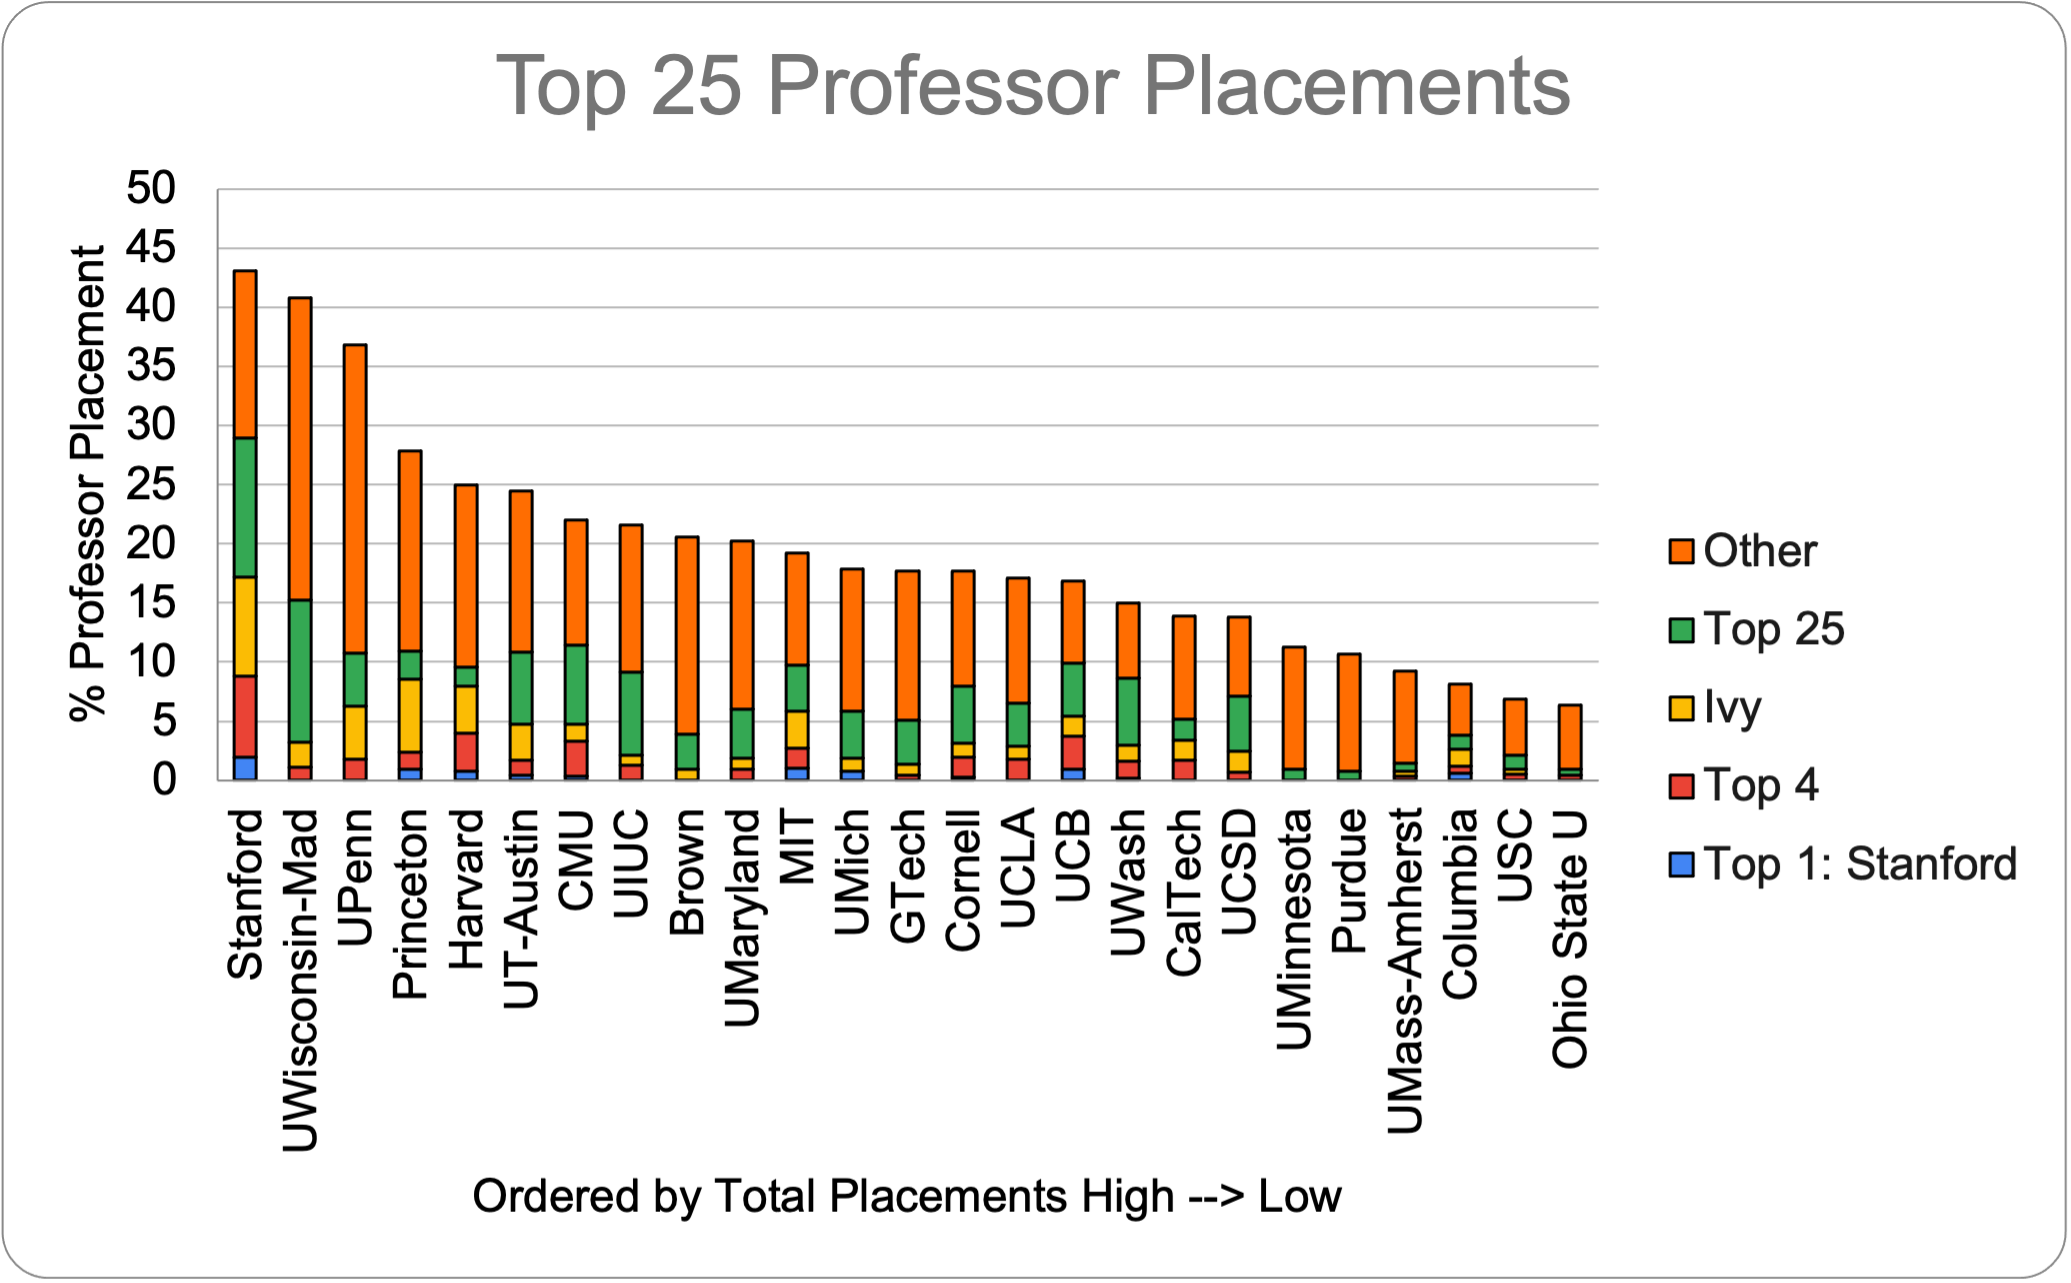
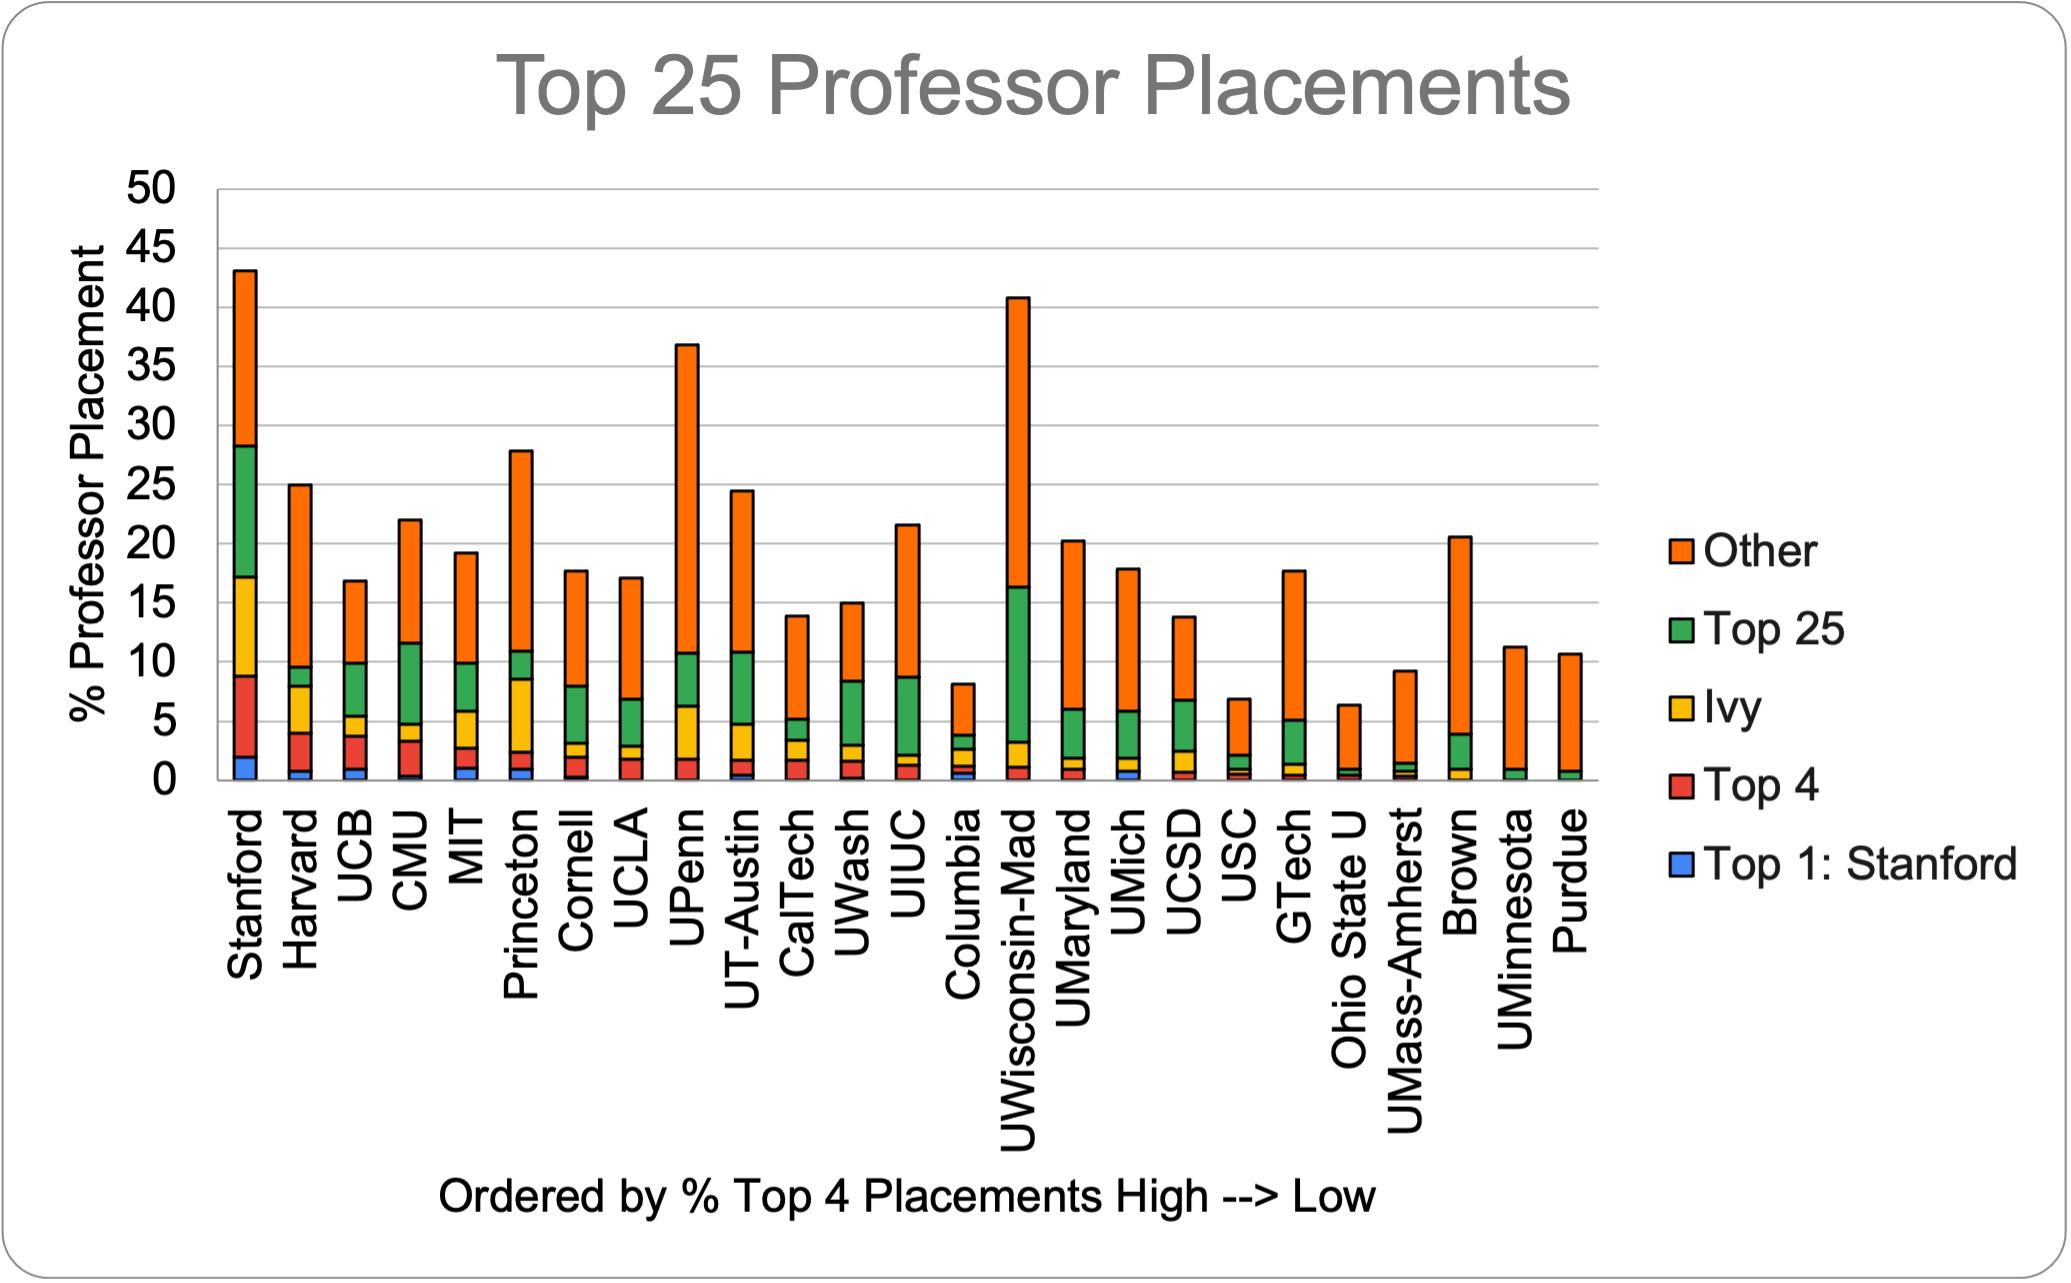
As shown by the following graph, magnitude of papers is not a good metric for success after taking normalization into account. One cannot infer whether a university has a high percentage of professor placements solely based on their total adjusted paper counts.
| University | % Placement Rank | US News | csrankings | Magnitude Placement | Best Paper Awards | Average Change |
| CalTech | 18 | 11 | 72 | 17 | 61 | +22.25 |
| Harvard | 5 | 16 | 31 | 6 | 48 | +20.25 |
| Brown | 9 | 26 | 44 | 16 | 26 | +19 |
| UMinnesota | 20 | 34 | 44 | 27 | 50 | +18.75 |
| UPenn | 3 | 17 | 15 | 14 | 32 | +16.5 |
| UWisconsin-Mad | 2 | 17 | 16 | 15 | 19 | +14.75 |
| Princeton | 4 | 9 | 24 | 8 | 16 | +10.25 |
| Ohio State U | 25 | 34 | 39 | 30 | 29 | +8 |
| UT-Austin | 6 | 9 | 16 | 12 | 10 | +5.75 |
| UMaryland | 10 | 17 | 10 | 19 | 15 | +5.25 |
| USC | 24 | 23 | 23 | 29 | 42 | +5.25 |
| UCLA | 15 | 11 | 20 | 20 | 24 | +3.75 |
| Stanford | 1 | 2 | 4 | 3 | 3 | +2 |
| Purdue | 21 | 20 | 18 | 21 | 33 | +2 |
| UMass-Amherst | 22 | 23 | 20 | 23 | 14 | -2 |
| UIUC | 8 | 5 | 3 | 5 | 8 | -2.75 |
| UMich | 12 | 11 | 9 | 9 | 6 | -3.25 |
| CMU | 7 | 2 | 1 | 4 | 2 | -4.75 |
| UCSD | 19 | 11 | 5 | 25 | 13 | -5.5 |
| GTech | 13 | 6 | 7 | 7 | 7 | -6.25 |
| Columbia | 23 | 11 | 12 | 24 | 18 | -6.75 |
| Cornell | 14 | 6 | 7 | 7 | 7 | -7.25 |
| MIT | 11 | 1 | 2 | 1 | 4 | -9 |
| UWash | 17 | 6 | 8 | 10 | 1 | -10.75 |
| UCB | 16 | 2 | 6 | 2 | 5 | -12.25 |
This info was manually gathered from various sources including source degrees conferred statistics from individual universities, Jeff Huang, CSrankings, and USNews. We analyzed the 25 universities with the top total professor placements according to Jeff Huang.
Unfortunately it is difficult to measure if the professor placement is due to lack of interest or failure to obtain a position.